ChatGPT’s o3 Pro AI model has analyzed 38 live indicators, from TradingView technicals and Binance order book flows to on-chain usage metrics and social sentiment, and has distilled a focused SUI price forecast as the token hovers near $2.78 ahead of potential catalysts.
RSI around 42.5 and a mild bearish MACD crossover indicate SUI is tucked between support near $2.70–$2.85 and resistance around $3.15–$3.20, even as daily volume exceeds $1.14 billion.
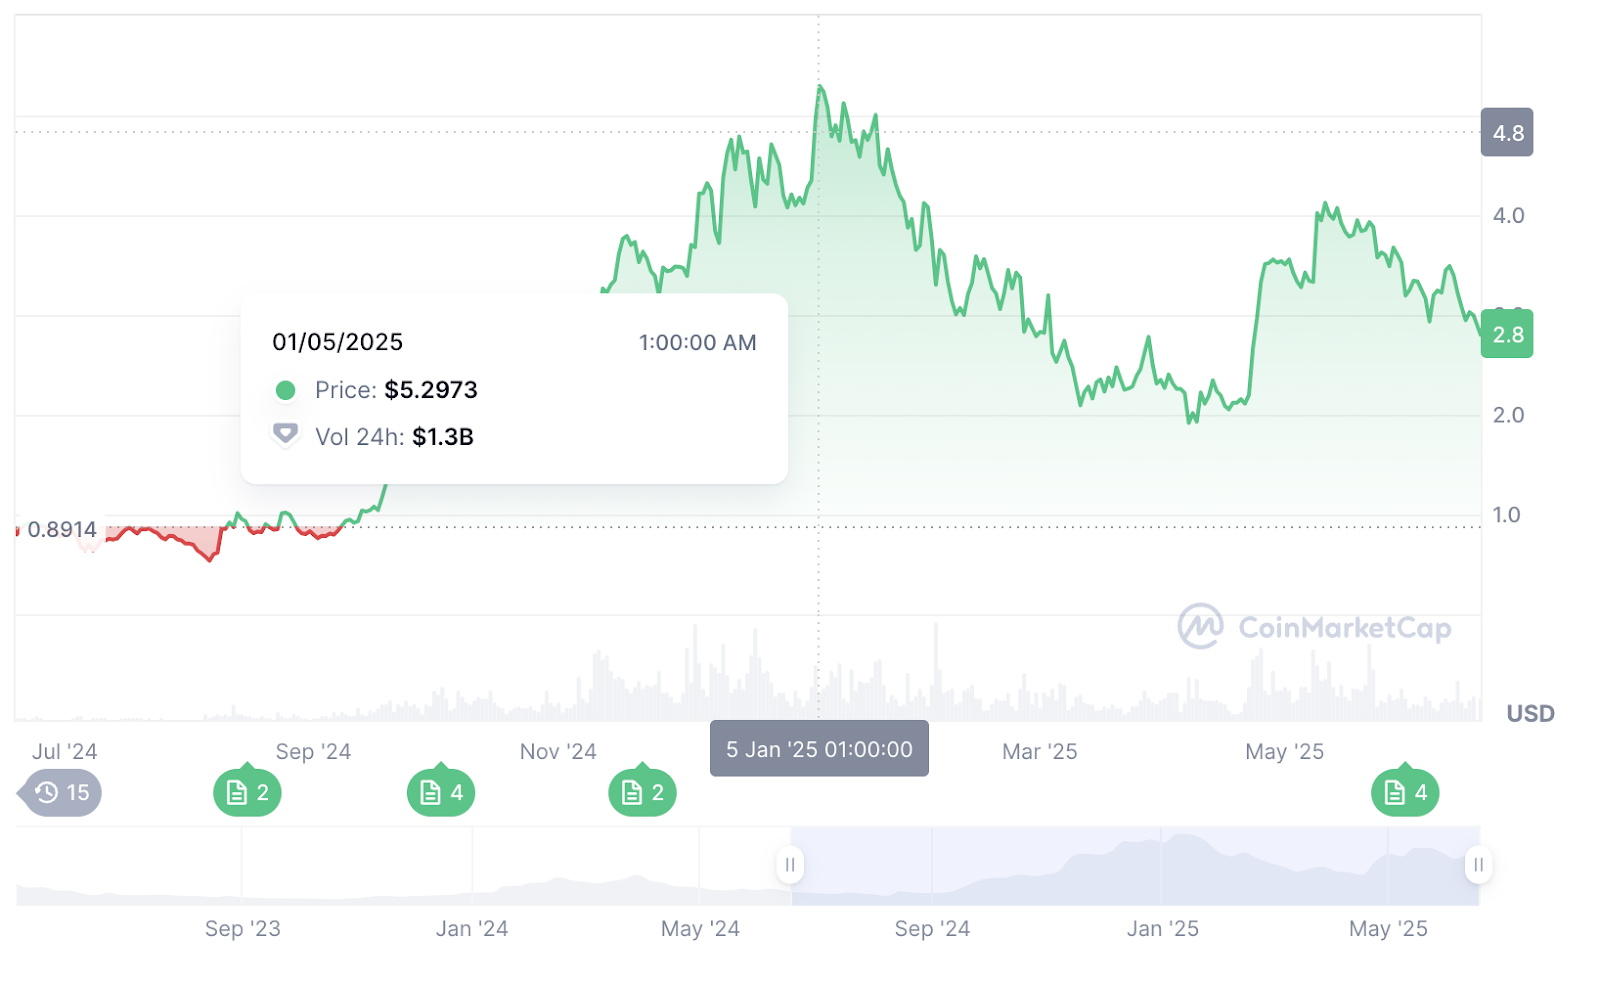
Since January’s $5.35 peak, the price has slid into a $2.81–$3.37 range by mid-June. However, active address growth, ecosystem developments, and social dynamics suggest that a sharper move may follow once volatility (ATR ~0.12 USDT) expands.
The following analysis was conducted using one of ChatGPT’s AI models, the new o3 pro. The predictions were then reanalyzed and edited together for enhanced readability while maintaining analytical precision.
Technical Pulse: SUI Price Coiled in a Tight Range
On the daily SUI/USDT chart at Binance, the market is clearly compressing. After reaching $5.35 in early January 2025, Sui retreated, settling into a band roughly between $2.70 and $3.15.

Momentum readings show caution, as an RSI near 42.5 sits below neutral without indicating an extreme oversold condition, and MACD’s line at approximately –0.0123 crossing under its signal around –0.0087 yields a slight negative histogram (~–0.0036), reflecting modest downward pressure rather than a decisive breakdown.
Volatility remains subdued, with ATR around 0.22 USDT implying daily swings of roughly 4% or less until an external trigger broadens the range.
Exponential moving averages further illustrate the bias. The 20-day EMA at about $2.81 lies just above the current price (~$2.78), while the 50-day EMA near $2.95 and the 100-day EMA around $3.10 hover overhead as a descending cluster that resists upward moves.
Price attempts to reclaim these averages have stalled, indicating sellers defend rallies within this compression.
Bollinger Bands, calculated on a 20-day SMA near $2.85 with upper and lower bands around $3.15 and $2.55, respectively, are narrowing in a classic squeeze; trading below the middle band hints at downward bias but leaves room for a bounce if support levels hold.
Classic pivot calculations from the prior session’s high, low, and close yield a pivot near $2.85, first support around $2.70, first resistance near $3.00, second support near $2.55, and second resistance close to $3.15.
These pivot points align with horizontal zones observed in recent swings: support around $2.60–$2.70 and resistance near $3.20–$3.30.
Historically, once ATR and volume pick up, such squeezes resolve sharply toward the next supply or demand zone. Until then, Sui will likely oscillate within $2.55–$3.15, favoring investors who respect intraday pivots and maintain tight risk management.
Support & Resistance Guide: Mapping the Crucial Zones
SUI’s immediate support rests near $2.70–$2.75, matching pivot S1 and recent swing lows seen in mid-June. If that buffer falters, the broader demand area stretches down to about $2.55, below which April’s trough near $2.11 becomes vulnerable only if sellers decisively breach the $2.55 level.
On the upside, initial resistance around $2.85–$2.90 (pivot and 20-day EMA) must yield before the price can test the 50-day EMA near $2.95. Pushing beyond $3.15 (upper Bollinger Band and pivot R2) would open room toward swing highs around $3.30–$3.40, last tested in early June before renewed downward pressure.
Clearing the 100-day EMA near $3.10–$3.15 on solid volume would suggest a potential shift back toward $3.50–$4.00, though climbing through residual supply from April–May recovery attempts (roughly $3.50–$4.13) may require a robust catalyst.
The key trigger lies in daily closes, as holding above $2.85–$2.90 indicates a short-term bullish tilt, whereas falling below $2.70 risks probing $2.55–$2.50.
Given an ATR-based expected daily range near $0.24, a breakout or breakdown beyond these pivot zones could materialize within a single trading day once volatility awakens.
Thus, investors should watch for ATR upticks alongside volume surges to confirm genuine directional moves rather than false breaks in a still-constricted market.
Liquidity & Market Depth: Is There Fuel for a Conviction Move?
With a market capitalization of approximately $9.5 billion and a fully diluted valuation of around $28 billion, SUI commands substantial liquidity across major exchanges.
Binance’s SUI/USDT order books typically absorb multimillion-dollar orders without severe slippage, a prerequisite for volatility expansions when triggered. The recent 24-hour turnover of $1.14 billion, about 12.5% of the market cap, reflects sustained trading engagement despite sideways price action.
According to on-chain and anecdotal indicators, the volume composition appears tilted toward spot accumulation rather than leveraged positions. This reduces the likelihood of forced liquidations and dampens explosive price swings until a clear catalyst emerges.
Order book clusters near $2.70–$2.80 on bids provide a cushion against moderate selloffs, while resting offers around $2.90–$3.00 absorb minor rallies unless buying pressure intensifies.
Observing the volume-weighted moving average (e.g., VWMA20) can reveal subtle accumulation. If VWMA rises while price lingers below EMAs, it hints at selective buying beneath an overall bearish-looking chart.
Overall, deep liquidity and sustained volume supply the fuel for a breakout once volatility picks up. Yet, price may remain confined within the established range without a clear catalyst, ecosystem news, macro shifts, or broader crypto sentiment changes.
The next decisive move will likely require an external spark to push through these liquidity zones.
OnChain Insights: Gauging Real Usage vs. Speculation
Despite SUI’s pullback from January highs, on-chain metrics indicate continued ecosystem engagement. Daily active addresses and transaction counts remain elevated, indicating usage-driven demand beyond mere speculation.
Thousands of daily users interacting with dApps, NFTs, DeFi, or emerging meme projects suggest a baseline of utility that can sustain price floors when volatility spikes.
Lockups of SUI tokens by projects or the foundation for staking or governance purposes could tighten the exchange float, exerting upward pressure when buying resumes.
Conversely, reports of large token dumps by early investors have amplified selling pressure, contributing to April’s dip.
Launches of large-scale dApps often drive transaction volume spikes, as users need SUI to pay fees and participate in tokenomics; such on-chain activity surges have historically preceded price rebounds.
Stablecoin or bridge flows also matter, as data indicating that SUI surpasses other chains in stablecoin transfers hints at infrastructural adoption that underpins long-term demand, even if price lags initially.
$SUI surpasses @Solana for the first time in weekly stablecoin transfers pic.twitter.com/vkPB1A59Hg
— ToreroRomero (@Torero_Romero) June 18, 2025
Network upgrades and partnerships, such as the cross-chain bridges, major wallet integrations, or rumored listings like Robinhood, can prompt anticipatory positioning, reducing float ahead of confirmation.
Monitoring these indicators reveals whether on-chain demand growth outpaces sell-side pressure from profit-taking or broader market weakness.
$SUI SURPASSES 210 MILLION TOTAL ACCOUNTS pic.twitter.com/mdQAaRI0zq
— ToreroRomero (@Torero_Romero) June 16, 2025
Sustained increases in active addresses or locked tokens during a volatility squeeze often presage bullish breakouts once sentiment shifts.
Social Sentiment Indicators: Reading the Community Pulse
LunarCrush data portrays an engaged but cautious SUI community. Galaxy Score near 42 sits below neutral 50, reflecting modest bullish bias rather than euphoria.
AltRank places SUI around 530 in a mid-tier engagement category. Yet engagement metrics show nearly 1.83 million interactions over 24 hours and rising mentions of about 17.5 K.
Sentiment hovers around 89% positive or neutral, though slight downward shifts hint at growing caution amid price decline.
A high volume of mentions and an expanding creator base (around 3.2K contributors) mean diverse narratives circulate: some emphasize SUI’s layer1 promise and utility gains (“surpassing Solana in stablecoin transfers”).
$SUI surpassing solana in stablecoins transfer is making it clear as the daylight
That the next retail onboarding chain is @SuiNetwork
Price action may not reflect it rn but when fundamentals start aligning, prices catch up sooner & at rapid pace!
Don't fade…. pic.twitter.com/Y2OYwBLudU— Momin (@mominsaqib) June 18, 2025
In contrast, others warn of token dumps or question near-term catalysts. Social dominance, which accounts for nearly 1.7% of crypto chatter, can spike around major headlines, quickly amplifying volatility.
Trending articles, comparisons with other L1s, forecast warnings, and listing speculation influence collective expectations. Positive headlines may spark short-term rallies, whereas contradicting reports fuel whipsaws.
$SUI SURPASSES $490 BILLION TOTAL TOKEN VOLUME pic.twitter.com/K4OtxsCgTf
— ToreroRomero (@Torero_Romero) June 17, 2025
Overall, mixed yet attentive sentiment suggests that a clear catalyst, such as a successful dApp launch, major listing, or macro relief, could rapidly shift conviction and trigger a pronounced move.
Until then, social-driven volatility is likely contained within the existing trading band, as bullish and bearish narratives balance each other.
Macro & Ecosystem Catalysts: Potential Sparks
Several developments could break SUI out of its current compression:
- Confirmation of a high-profile listing or integration, such as on Robinhood or large wallet/payment platforms, would expand access and likely reignite buying pressure. Partnerships with prominent DeFi protocols or cross-chain bridges, enhancing utility, can reshape market perception.
- Launches of ecosystem milestones, high-profile dApps, NFT marketplaces, gaming projects, or DeFi protocols that drive substantial transaction volume and token lockups can tighten float and underpin price support.
- Network upgrades that improve throughput and interoperability (e.g., seamless bridges) or introduce novel features (e.g., zkrollup integration) boost developer interest and indicate maturation, encouraging longer-term investment.
- A broader crypto rally, driven by macro liquidity, ETF approvals, or risk-on shifts, often lifts altcoins alongside Bitcoin and Ethereum; Sui could attract spillover capital if technical conditions permit.
- Tokenomics events, including vesting or unlock schedules, may pressure price when large holders sell; however, coordinated lockups or buyback programs could produce bullish supply shocks. Clear communication around token release schedules is vital to manage expectations.
- Regulatory clarity favoring layer-1 blockchains and DeFi can indirectly benefit Sui by boosting sector confidence.
- Broader market shocks, geopolitical tensions, or macro risk-off episodes can trigger capital rotations; Sui’s on-chain usage resilience might lend relative shelter, though initial dips often precede recoveries if fundamentals hold.
The interplay and timing of these catalysts against SUI’s technical squeeze will determine the breakout direction. Investors should monitor news flow, on-chain and social metrics, and volume/volatility shifts as potential catalysts emerge.
Three-Month SUI Price Forecast Scenarios
In the coming 90 days, SUI’s path will likely fall into one of three broad scenarios.
Range-Bound Consolidation (Base Case)
SUI may oscillate between roughly $2.55 and $3.15 without a clear catalyst or favorable macro shift. Technical indicators, such as the RSI lingering near 40–50, MACD near neutral, and EMAs overhead, point to a balanced tug of war.
On-chain usage remains steady but not surging, and social sentiment stays mixed, containing the price within the established band. Volatility (ATR ~0.12 USDT) and volume hold near current levels, punctuated by occasional spikes insufficient to breach pivot zones.
In this environment, short-term investors can exploit intraday swings with tight risk controls, while longer-term participants await directional clarity before substantially altering positions.
Bull Breakout Toward $4+ (Bull Case)
A convergence of positive catalysts, such as a major listing announcement, a surge in dApp adoption metrics, or a broad crypto upswing, could drive volume and volatility above normal, pushing the price above $3.15 (upper Bollinger Band/pivot R2) and clearing the 100-day EMA near $3.10.
An RSI climbs above 50, and a bullish MACD crossover would confirm a momentum shift. On-chain metrics (active addresses, transaction volume, token lockups) would need to spike to validate demand, and social indicators (Galaxy Score above 60, surging engagement) would amplify interest.
The initial upside could target $3.50–$4.00, with the potential to retest at $5.00 if momentum persists in a constructive, broader market.
However, risk management remains essential. Traders should take profits near resistance and rely on volume to sustain moves, using trailing stops or staged exits to guard against sudden reversals if sentiment overheats.
Downside Breakdown Toward $2 or Lower (Bear Case)
Negative catalysts, such as disappointing ecosystem developments, macro risk-off, or large insider selloffs, could trigger a high volume breach of $2.70 support.
Confirmation would come from an RSI drop below ~35, a deepening negative MACD, and a spike in ATR indicating panic-like volatility. Onchain signals would show stalled or declining active address growth, token unlock events flooding exchanges, and weakening transaction metrics, pointing to fading demand.
Social sentiment might plunge (Galaxy Score falling below ~30), with engagement skewing negative and accelerating selling pressure.
In this scenario, the price could test April lows near $2.11 and psychological $2.00; breaking these could open paths toward $1.80 or lower if macro conditions remain hostile.
Investors should employ stop losses below key supports and consider hedging, while long-term holders assess whether fundamental prospects justify adding at lower levels or if risks outweigh potential gains.
SUI Price Forecast: Converging Signals at a Key Juncture
Across technical charts, on-chain metrics, and social feeds, SUI exhibits pronounced compression. The price is wedged between $2.70 support and $3.15 resistance, with EMAs overhead indicating caution.
Onchain engagement remains healthy, and social attention stays high, but undecided. The next directional move will depend on how catalysts intersect with this squeeze.
Market participants should treat each swing as a data signal: does the price hold near $2.70 for rising on-chain usage? Does a listing or partnership coincide with higher Galaxy Scores and volume that propel the price above $3.15? Conversely, do token unlocks or negative macro news induce a drop below $2.55, and if so, can onchain stickiness or community buy-ins arrest deeper declines?
Active, real-time monitoring, which includes recalculating indicators, analyzing order book depth, and tracking sentiment flows, can refine decisions amid uncertainty.
Geopolitical or macro shifts, such as the ongoing Israel-Iran war, also factor in risk-off periods. Altcoins often suffer steeper drawdowns yet may rebound faster if on-chain fundamentals remain intact.
What’s Next for SUI?
SUI’s compression between $2.70 and $3.15 reflects a market at a crossroads: technical indicators hint at bearish bias yet show readiness for a breakout when catalysts align; on-chain metrics reveal sustained engagement despite price declines; social sentiment remains engaged but uncertain.
Over the next 90 days, forces such as major listings, ecosystem milestones, macro tides, or tokenomics events will determine whether Sui reclaims higher ground toward $4–$5 or revisits deeper support near $2.00–$2.10.
Investors should watch daily closes above $3.15 for bullish conviction or below $2.70 for bearish confirmation, while monitoring ATR and volume spikes as early warnings of volatility expansion.
Simultaneously, on-chain usage trends and social sentiment shifts, such as rising active addresses or a jump in Galaxy Score above 60, offer context to validate moves or indicate caution.
SUI’s trajectory will mirror the interplay between its fundamental advancement as a layer-1 platform and broader market dynamics.
SUI’s journey from January highs through midyear consolidation shows both opportunity and risk, and investors should pay close attention to it.
The post ChatGPT’s 38-Signal SUI Price Forecast Flags Major Breakout Ahead of Key Catalyst appeared first on Cryptonews.


