CryptoMediaClub
Wednesday, May 6, 2026
  • All news
  • Bitcoin
  • Ethereum
  • Altcoins
  • NFT
  • Blockchain
  • Analysis
No Result
View All Result
  • All news
  • Bitcoin
  • Ethereum
  • Altcoins
  • NFT
  • Blockchain
  • Analysis
No Result
View All Result
CryptoMediaClub
No Result
View All Result
Home Analysis

Adjusting Bitcoin’s price for US liquidity reveals key indicator for bull run

08.08.2023
A A
0
146
VIEWS
ShareShare

The M1 money supply, a key economic indicator, represents the total amount of physical currency in circulation, including coins, notes, traveler’s checks, and demand deposits.

Essentially, it measures an economy’s liquidity and the public’s spending power.

In the context of the cryptocurrency market, comparing Bitcoin’s spot price to the M1 money supply provides an interesting insight into the digital asset’s relative worth and potential for future growth.

This comparison can serve as a tool for investors and economists to assess the scale of Bitcoin in relation to traditional money supply and its potential implications on global economic structures.

Moreover, tracking changes in Bitcoin’s value against the M1 money supply can potentially highlight shifts in public sentiment towards traditional fiat currencies and digital assets, offering a unique perspective on the evolving financial landscape.

In the chart below, the ratio of Bitcoin’s spot price to the M1 money supply (BTCUSD/M1SL) is always higher than Bitcoin’s spot price until Q1 2020.

This trend has been observed on a logarithmic scale, emphasizing the relative growth rates and proportional changes between these metrics. Notably, Bitcoin’s price, when adjusted for the M1SL hasn’t reached an all-time high since 2017.

Graph comparing Bitcoin's spot price to BTCUSD/M1SL from 2014 to 2023 (Source: TradingView)
Graph comparing Bitcoin’s spot price to BTCUSD/M1SL from 2014 to 2023 (Source: TradingView)

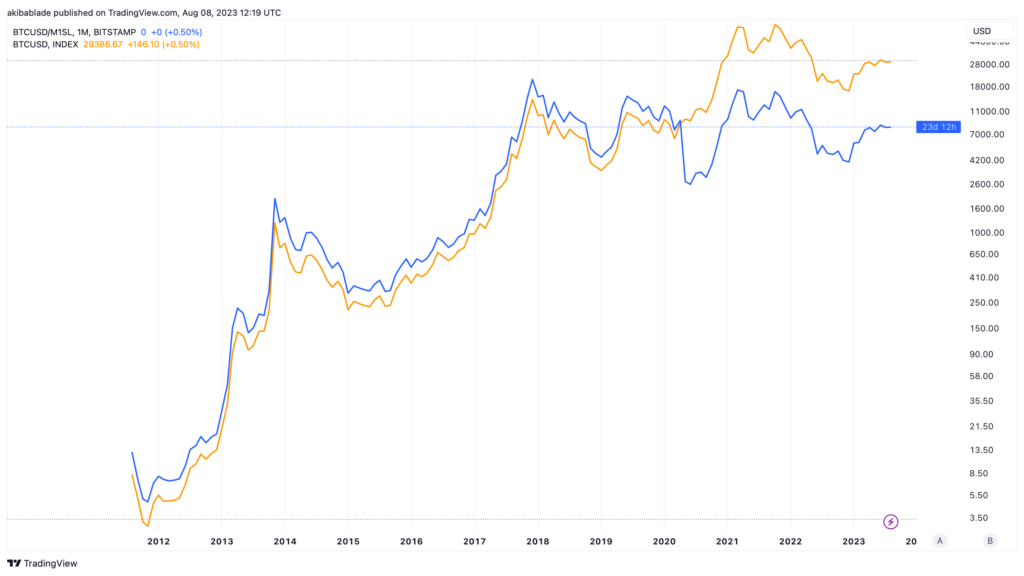
Presenting Bitcoin’s spot price as consistently lower than BTCUSD/M1SL indicates that the growth rate of Bitcoin’s price was lagging behind the growth rate of the M1 money supply or that the M1 money supply was growing at a higher rate than Bitcoin’s price.

This aligns with the macroeconomic analysis of the time, given that traditional fiat currencies and liquidity in the economy were expanding more rapidly than the demand or valuation of Bitcoin. Bitcoin was also less correlated with conventional financial markets and economic indicators during this period.

Then, the shift from May 2020, when Bitcoin’s price began to rise after the halving, appears to indicate that Bitcoin’s growth rate started to outpace the growth rate of other assets.

BTC M1SL
Graph comparing Bitcoin’s spot price to BTCUSD/M1SL from 2014 to 2023 (Source: TradingView)

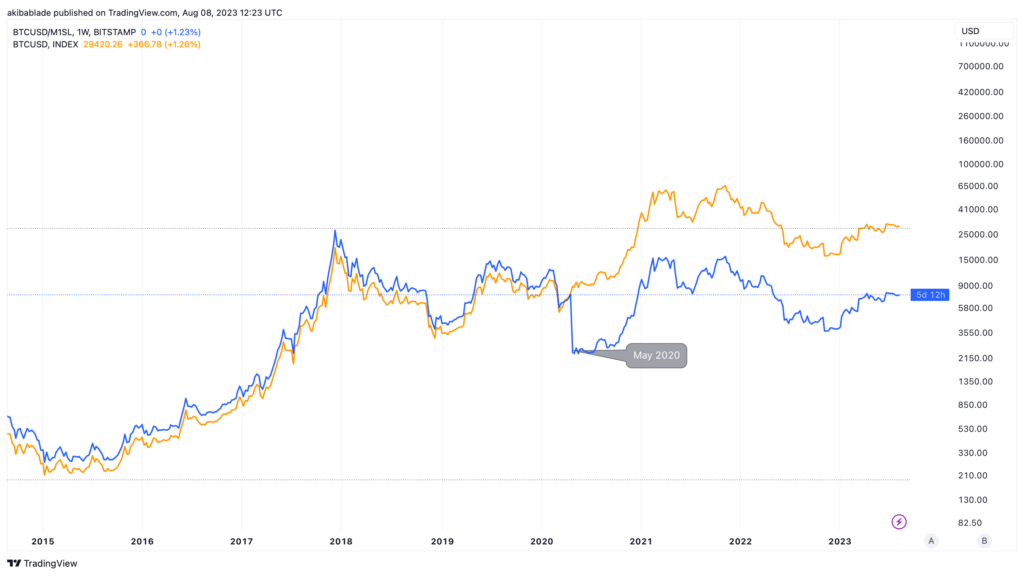
However, the BTCUSD/M1SL chart shows that the value of Bitcoin relative to the total amount of fiat money in circulation decreased. This could be attributed to a couple of factors.

One could be the result of the monetary policies enacted by the Federal Reserve. As the COVID-19 pandemic hit, central banks injected large amounts of liquidity into their economies to curb the anticipated economic downturn. This led to an increase in the M1 money supply, subsequently causing a decrease in the BTCUSD/M1SL ratio.

However, it’s important to note that this decrease in the BTCUSD/M1SL ratio doesn’t necessarily indicate a reduction in the intrinsic value or potential of Bitcoin. Instead, it reflects the changes in economic conditions and market sentiment at the time.

While the price of Bitcoin increased in dollar terms, the relative liquid worth of the dollar also declined as supply skyrocketed. The M1SL rose 426% over 700 days, increasing the M1 supply to $20.8 trillion from $3.95 trillion. The equivalent change in Bitcoin supply would be to go from 21 million coins to 88 million.

In the future, should the BTCUSD/M1SL chart flip the BTCUSD price again, it could signal an acceleration in Bitcoin’s actual dollar value. The current gap between the orange and blue lines on the chart essentially represents the excess liquidity in the US markets post2020. In this situation, either the Bitcoin price rises relative to the M1SL or the M1SL declines while Bitcoin holds steady.

However, if the M1SL declines in tandem with a decrease in Bitcoin’s price, it may signify a reduced perceived dollar valuation for the top cryptocurrency by market cap.

The observed trends between BTCUSD and BTCUSD/M1SL provide valuable insights, highlighting factors beyond simple price comparisons needed to gain a true sense of the value of digital assets such as Bitcoin.

It serves as a reminder that even in the rapidly evolving world of cryptocurrencies, traditional economic indicators like the M1 money supply still hold relevance and can provide valuable context for understanding crypto market dynamics.

The post Adjusting Bitcoin’s price for US liquidity reveals key indicator for bull run appeared first on CryptoSlate.

Share11Tweet7ShareSharePin3

Related Posts

Bitcoin rips past $82,000, shorts liquidated after President Trump halts Hormuz operation sending oil price spiralling
Analysis

Bitcoin rips past $82,000, shorts liquidated after President Trump halts Hormuz operation sending oil price spiralling

06.05.2026
0

Bitcoin rose above $82,000 as oil prices tumbled amid a powerful tailwind from a sudden and dramatic de-escalation in US-Iran...

Read moreDetails
Can Bitcoin break a new 2026 high this week – or will geopolitics cause another weekend reset?

Can Bitcoin break a new 2026 high this week – or will geopolitics cause another weekend reset?

06.05.2026
Bitcoin sellers take profits above $80,000, but ETF demand keeps $90,000 rally hopes alive

Bitcoin sellers take profits above $80,000, but ETF demand keeps $90,000 rally hopes alive

05.05.2026
Ethereum’s biggest staker has just become a public company with over $10 billion locked up

Ethereum’s biggest staker has just become a public company with over $10 billion locked up

05.05.2026
Bitcoin rally breaks from US stock market as mixed macro data creates bullish setup for BTC

Bitcoin rally breaks from US stock market as mixed macro data creates bullish setup for BTC

05.05.2026
Load More
Next Post
BlackRock Bitcoin ETF Approval Inches Closer: Industry Insiders Share Insights

BlackRock Bitcoin ETF Approval Inches Closer: Industry Insiders Share Insights

0 0 votes
Рейтинг статьи
Subscribe
Notify of
guest
guest
0 комментариев
Oldest
Newest Most Voted
Inline Feedbacks
View all comments

Recommended

Circle Launches Multichain Gateway for USDC

Circle Launches Multichain Gateway for USDC

9 months ago

Ethereum Post-Merge: Over 100K Coins Eliminated From ETH’s Supply

3 years ago
U.S. Supreme Court Declines Case on Seized $4.38 Billion Bitcoin from Silk Road

U.S. Supreme Court Declines Case on Seized $4.38 Billion Bitcoin from Silk Road

2 years ago
Why Is Crypto Up Today? – September 30, 2025

Why Is Crypto Up Today? – September 30, 2025

7 months ago

Categories

  • All news
  • Altcoins
  • Analysis
  • Bitcoin
  • Blockchain
  • Ethereum
  • NFT
No Result
View All Result

Highlights

Can Bitcoin break a new 2026 high this week – or will geopolitics cause another weekend reset?

Bitcoin Price Prediction: Data Shows Bitcoin’s Entire Recovery Is Happening During ETF Trading Hours — What Does That Mean for Retail Traders?

BsStrategy Turns AI Quantitative Trading Into a Simpler Starting Point for 2026 Market Participants

Ripple News: Moscow Exchange to Publish Official XRP Index Next Week

Ethereum Price Fighting $2,400 Resistance: Tom Lee Declares Crypto Spring as Bitmine Hit 5.18 Million ETH

Leading AI Claude Price Prediction of XRP, Bitcoin and Solana by the end of May 2026

Trending

SKYAI Jumps 235% as Meme Coin Trading Heats Up; Maxi Doge Presale Nears $4.8M
All news

SKYAI Jumps 235% as Meme Coin Trading Heats Up; Maxi Doge Presale Nears $4.8M

06.05.2026
0

Wednesday 6 May 2026 – SKYAI posted one of the week’s biggest moves in crypto, surging 235%...

Bitcoin rips past $82,000, shorts liquidated after President Trump halts Hormuz operation sending oil price spiralling

Bitcoin rips past $82,000, shorts liquidated after President Trump halts Hormuz operation sending oil price spiralling

06.05.2026
Bitcoin Price Prediction: The Hidden Timing of Daily Pump-and-Dump Cycles

Bitcoin Price Prediction: The Hidden Timing of Daily Pump-and-Dump Cycles

06.05.2026
Can Bitcoin break a new 2026 high this week – or will geopolitics cause another weekend reset?

Can Bitcoin break a new 2026 high this week – or will geopolitics cause another weekend reset?

06.05.2026
Bitcoin Price Prediction: Data Shows Bitcoin’s Entire Recovery Is Happening During ETF Trading Hours — What Does That Mean for Retail Traders?

Bitcoin Price Prediction: Data Shows Bitcoin’s Entire Recovery Is Happening During ETF Trading Hours — What Does That Mean for Retail Traders?

06.05.2026
  • All news
  • Altcoins
  • Bitcoin
  • Blockchain
  • Ethereum
  • NFT
  • Analysis
Editor: cryptomediaclub.com@gmail.com
Advertising: digestmediaholding@gmail.com

Disclaimer: Information found on CryptoMediaClub is those of writers quoted. It does not represent the opinions of CryptoMediaClub on whether to sell, buy or hold any investments. You are advised to conduct your own research before making any investment decisions. Use provided information at your own risk.
CryptoMediaClub covers fintech, blockchain and Bitcoin bringing you the latest crypto news and analyses on the future of money.

© 2023 Crypto News. All Rights Reserved

No Result
View All Result
  • All news
  • Bitcoin
  • Ethereum
  • Altcoins
  • NFT
  • Blockchain
  • Analysis

Disclaimer: Information found on CryptoMediaClub is those of writers quoted. It does not represent the opinions of CryptoMediaClub on whether to sell, buy or hold any investments. You are advised to conduct your own research before making any investment decisions. Use provided information at your own risk.
CryptoMediaClub covers fintech, blockchain and Bitcoin bringing you the latest crypto news and analyses on the future of money.

© 2023 Crypto News. All Rights Reserved

wpDiscuz