Bitcoin's slide into the high-$50,000s has put my $49,000 cycle-low map back into the live market conversation.
BTC is trading around $58,600 on July 1, down more than 19% over 30 days and roughly 53.5% below its all-time high of $126,198, according to CryptoSlate's Bitcoin market data.
 #1 Bitcoin BTC $58,485.20 -1.01% (24H) 1D 7D 1M 1Y ALL Market Cap $1.17T 24h Volume $34.06B All-Time High $126,198.07 Sectors Layer 1 PoW
BTC printed around $60,000 from June 26 through June 29, then fell to $57,735 early July 1 during Asia trading hours.
That leaves price close enough to my lower channel levels for the old framework to move from background risk to active decision map.
A $49,000 path still needs acceptance below the high-$50,000s and confirmation from the same stress stack I used in the original thesis: weak ETF demand, fragile leverage, miner pressure, and limited spot absorption.
 Related Reading
Akiba's medium term $49k Bitcoin bear thesis – why this winter will be the shortest yet
Shorter bears, sharper floors: why $49k could print early, and what would flip the tape. Nov 24, 2025 · Liam 'Akiba' Wright
My current BTCUSD daily chart puts the first lower channel floor near $56,647, the next boundary near $55,739, and the lower blue channel support near $49,794.
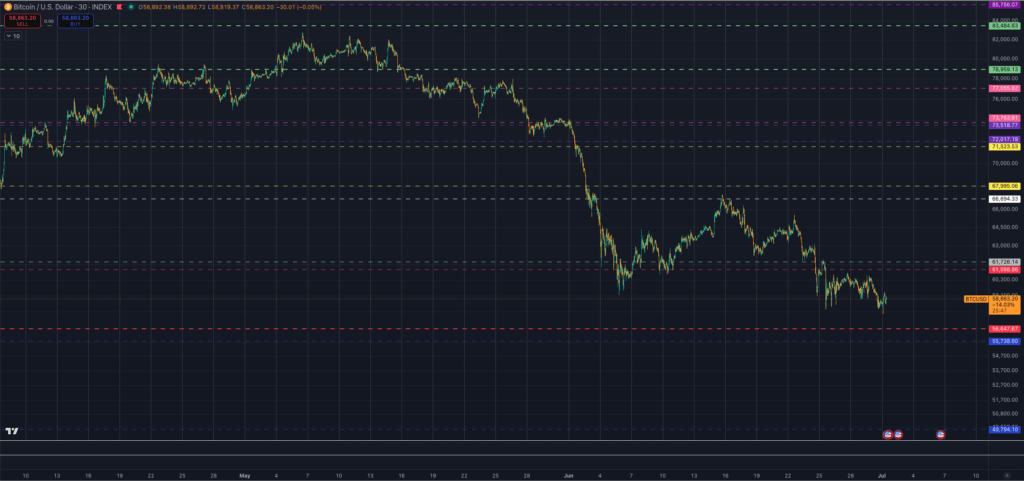
After fresh local lows in the $57,500-$57,800 area and a rebound toward $58,200-$58,600, Bitcoin is close enough to those levels that the framework now has to be tested by actual demand.
Why the $49K Map Is Back in Play
When I first laid out my medium-term Bitcoin bear thesis, $49,000 was a cycle-clearing base case built around several conditions lining up at once.
The stack was miner economics weakening, fee share staying soft, hashprice pressure increasing, ETF flow elasticity failing, leverage clearing lower, and spot demand arriving too slowly to absorb the move.
The thesis was always conditional. If fees are recovered, ETF demand remains resilient, and forced selling clears before the market loses its higher support shelves, the low could form above $49,000.
If those inputs deteriorated together, the high-$40,000s would have been the zone where the cycle would have to wash out.
That same logic carried through my January update and February follow-up. Price had not reached the target zone then, but the plumbing was already the part to watch.
Each failed repair level made the same test sharper: whether buyers could prove demand before the deeper cycle inputs worsened.
The July break puts that test back in front of the market. BTC near $58,000 now sits above the channel levels I am watching, while recent CryptoSlate coverage has already addressed the exhaustion-versus-acceptance question around $58,000, the IBIT sell-wall risk, the $60,000 derivatives setup, and the 200-week moving average break.
 Related Reading
Bitcoin’s weekend test is whether the $58,000 drop was exhaustion or acceptance
With ETF trading paused and options expiry settling, Bitcoin’s weekend test is whether the move toward $58K was forced-selling exhaustion or the start of a lower range. Jun 27, 2026 · Gino Matos

The $49K map ties those signals into one decision framework.
For me, the distinction is between location and proof. Price near $58,000 gives the map relevance; acceptance below the next two channel boundaries would give it evidence.
That keeps the analysis anchored in behavior across sessions: whether buyers step in before $56,600, whether flows stabilize before the next shelf, and whether the market can hold a repair level after leverage clears.
The lower blue channel remains a risk zone until those inputs line up. Then it becomes the area where the cycle-low thesis faces its most direct test.
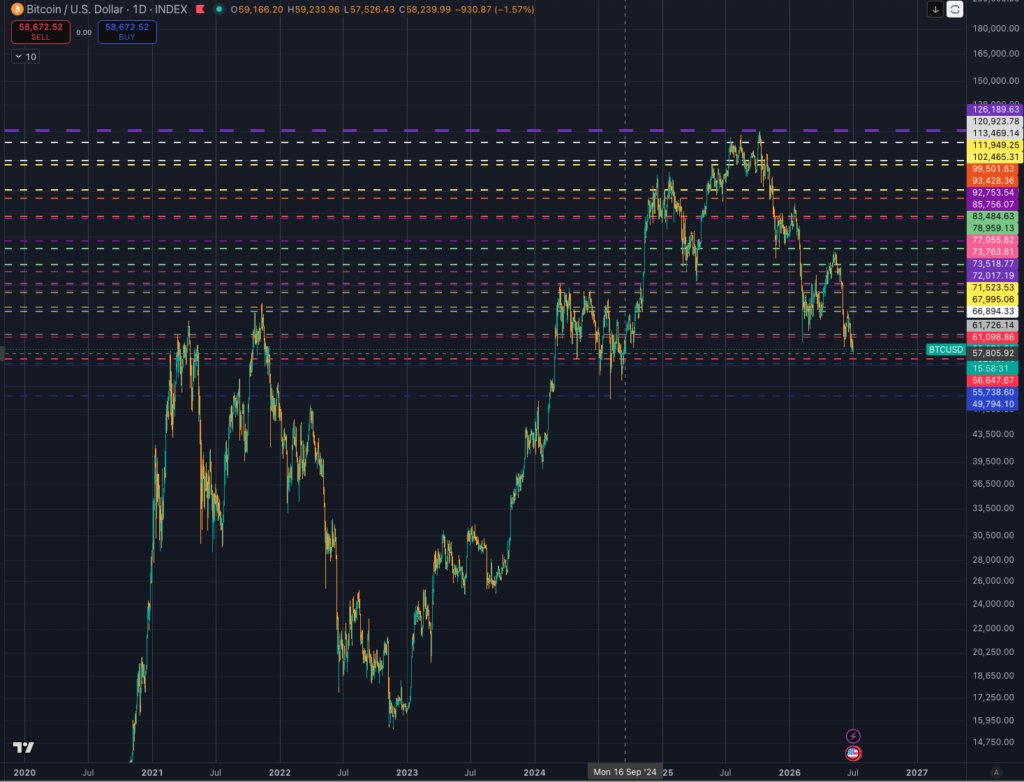
The Tests Before $49,794
My June channel-map work was built around acceptance across sessions rather than on a single candle. The same rule applies here.
A wick into the lower channel can still reverse quickly. I want to see where Bitcoin accepts trade, where sellers stop getting paid, and where spot demand shows up if the market tests the next shelf.
| Level or zone | Market role | What would confirm it | What would weaken it |
|---|---|---|---|
| High-$50Ks to $60,000 | The failed repair band | Repeated rejection below $60,000 and closes that keep BTC pinned near $58,000 | A reclaim of $60,000 that holds across sessions |
| $56,647 | The current lower channel floor on my chart | Acceptance below it with ETF outflows and leverage pressure still present | A fast recovery back into the high-$50,000s |
| $55,739 | The next boundary before the lower blue channel | Price treating the prior floor as resistance | Strong spot demand absorbing the break |
| $49,794 | The lower blue-channel support and the old $49K cycle-low zone | A sustained loss of the mid-$50,000s while the thesis inputs keep deteriorating | ETF flows stabilizing, leverage clearing cleanly, and miner stress failing to confirm |
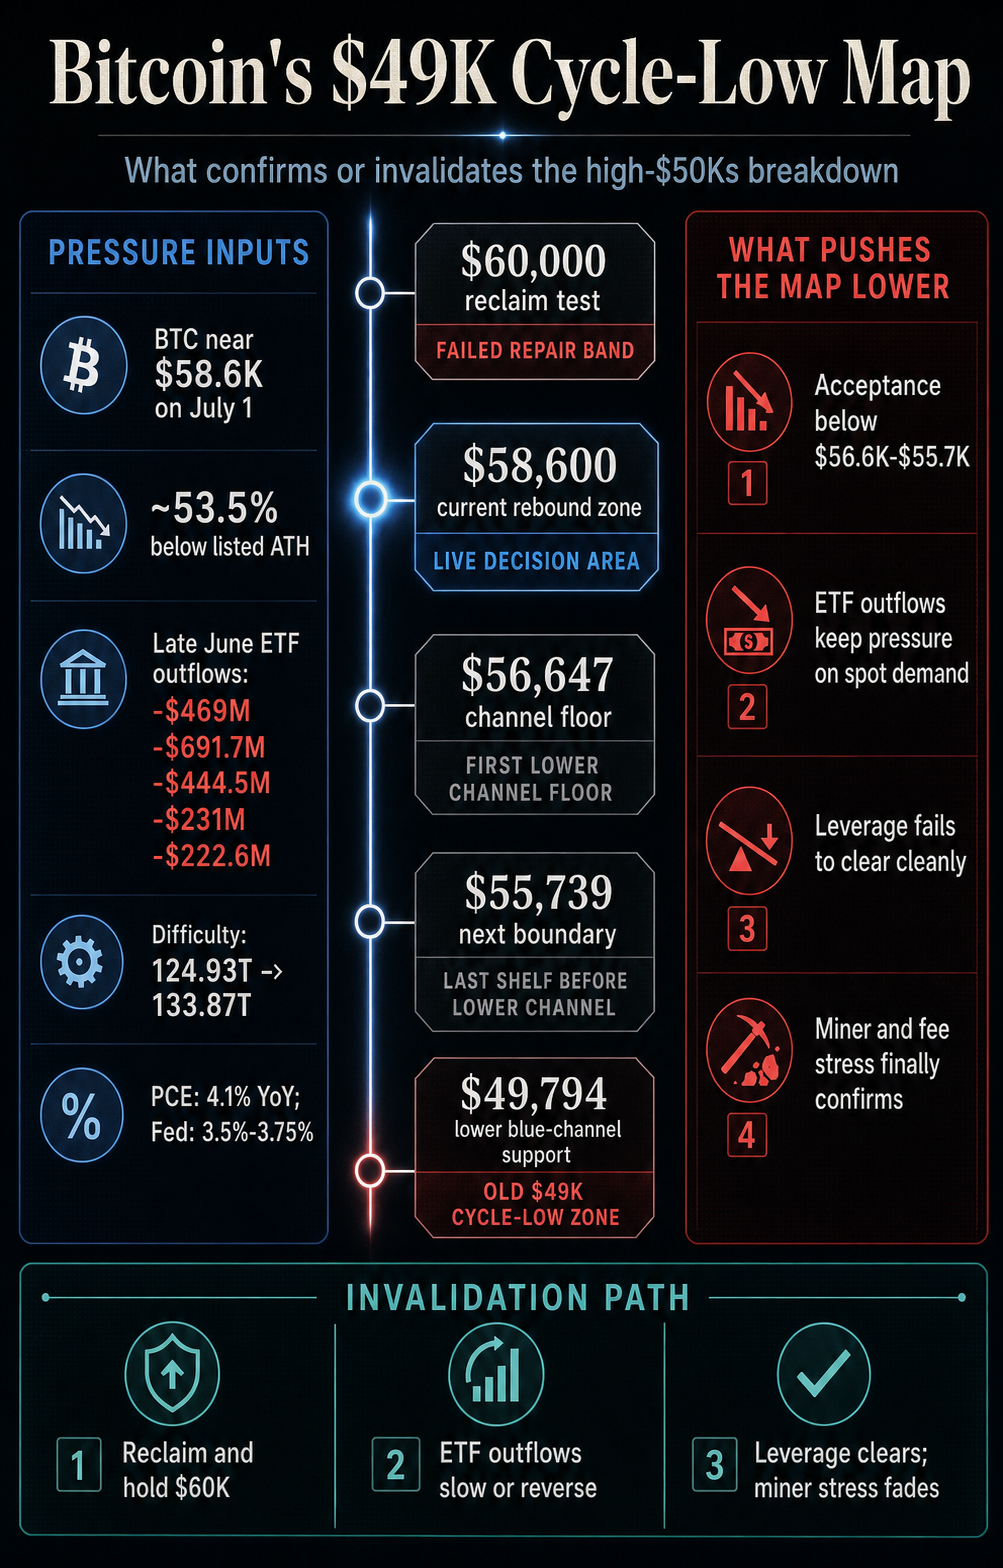
Those levels function as decision zones. The market can cut through a level intraday and still reject the breakdown.
It can also hold a level for a day or two while the underlying flow picture continues to deteriorate. The important test is acceptance.
The ETF side has moved in the direction the old thesis warned about. The Farside Bitcoin ETF table showed repeated negative daily totals late in June, including outflows of $469 million on June 24, $691.7 million on June 25, $444.5 million on June 26, $231 million on June 29, and $222.6 million on June 30.
ETF flow pressure is only one input, but the current flow record has yet to show the kind of steady demand response that would push the $49K path back to the edge of the map.
 Related Reading
Bitcoin’s biggest ETF is becoming the sell wall bulls have to break
IBIT still dominates the spot Bitcoin ETF market, but Farside's latest flow data shows its scale can now work in reverse when Bitcoin needs fresh spot demand around $60,000. Jun 28, 2026 · Liam 'Akiba' Wright
IBIT adds holder-pressure context. BlackRock's iShares Bitcoin Trust ETF page showed net assets around $43.23 billion, a NAV of $33.19 at the bottom of its 52-week range, and a year-to-date NAV return down 31.08% as of late June.
That supports the idea that ETF-era exposure is under pressure, while the separate sell-wall mechanics are better treated through CryptoSlate's IBIT flow coverage.
Leverage can still accelerate the next break. CoinGlass gives a live futures backdrop, while CryptoSlate's June 25 coverage of the long-liquidation flush showed how quickly the market can turn when the round-number repair level fails.
The current setup should be understood as a form of conditional leverage fragility. If $56,600-$55,700 breaks while positioning remains exposed, the move toward the lower channel can feed on itself.
Macro adds another constraint. The Bureau of Economic Analysis reported headline PCE inflation up 4.1% year over year in May, and the Federal Reserve held rates at 3.5%-3.75% while noting that inflation remains elevated relative to target.
That backdrop limits the relief narrative, even as BTC is already failing to reclaim $60,000.
Miner confirmation remains the unresolved leg. My original thesis leaned heavily on miner economics, fee share, hashprice, and forced stress.
Difficulty data from CoinWarz showed Bitcoin difficulty rising from roughly 124.93 trillion on June 26 to about 133.87 trillion on July 1, up about 7.15% over seven days.
Difficulty leaves hashprice and fee revenue unresolved, so it acts as a counterweight to any claim that the mining leg of the $49K thesis has fully fired.
That is the balance: ETF flow and price structure have moved toward the thesis; leverage can accelerate the next break; macro is a constraint; miner capitulation still needs confirmation.
 Related Reading
Bitcoin just slipped below the bear-market line traders cannot ignore
The 200-week break now depends on whether ETF outflows fade or turn the level into resistance. Jun 28, 2026 · Liam 'Akiba' Wright
What Would Invalidate the $49K Path
The clean invalidation is simple. Bitcoin needs to reclaim the high-$50,000s and then hold $60,000 with actual demand behind it.
ETF outflows need to slow or reverse. Leverage needs to clear without a fresh downside cascade. Miner and fee stress need to fail to confirm.
If those things happen, the $49K map reverts to a risk scenario rather than the live framework.
The market would be saying the high-$50,000s were the exhaustion low buyers wanted, not the shelf before the lower channel gets tested.
If the opposite happens, the map becomes more important. Acceptance below $56,647 would put the current channel floor behind the market.
Acceptance below $55,739 would start to turn the next boundary into resistance. If that happens while ETF outflows continue, leverage remains fragile, and miner economics finally deteriorate, then the $49,794 support becomes the real cycle test rather than a distant line on an old chart.
My $49,000 cycle-low thesis is back on the table because Bitcoin has moved close enough to the lower channel for the framework to guide the next decision.
Confirmation comes from acceptance below the mid-$50,000s and a stress stack that continues to build. Invalidation comes from demand reclaiming $60,000 and proving that the high-$50,000s were a clearing low rather than the next shelf down.
The post Bitcoin’s $57K slide puts my $49K cycle-low thesis in play unless bulls reclaim $60K appeared first on CryptoSlate.