CryptoMediaClub
Monday, August 17, 2026
  • All news
  • Bitcoin
  • Ethereum
  • Altcoins
  • NFT
  • Blockchain
  • Analysis
No Result
View All Result
  • All news
  • Bitcoin
  • Ethereum
  • Altcoins
  • NFT
  • Blockchain
  • Analysis
No Result
View All Result
CryptoMediaClub
No Result
View All Result
Home Analysis

Why $60,000 decides whether Bitcoin’s recent strength cracks as nearly half the market slips into loss

05.04.2026
A A
0
122
VIEWS
ShareShare

Bitcoin's price is still trading far above the depths of past bear markets, and that distance is now making the current moment feel pretty disorienting. Under the surface, a huge share of the market is already back in pain.

On-chain data show that by early April, roughly 46% of Bitcoin's supply was being held at a loss, meaning that nearly half of the coins on the network were last bought at prices above the current market price.

Markets tend to get emotionally unstable when large numbers of people are trapped in losing positions, and the gap between what a price chart shows and what the holder base actually feels can be quite large.

That's why the $60,000 level stands out. The number itself is all nice and round and memorable, but its real importance is in how it affects behavior. A move back there would pull even more of the market underwater and turn a slow grind lower into a vertical drop, a direct test of whether holders keep waiting or finally start selling.

People who bought during the run-up have long since shifted their attention from the next all-time high to harder questions: whether they misread the market, whether they should cut risk, and whether this drawdown has further to run. That's the territory where bottoms tend to form, and where panic, once it finds a foothold, tends to spread.

The deeper floor is still standing

The market is hurting, and the underlying levels that defined older cycle washouts are still holding.

The best example of this is the realized price, one of Bitcoin's simplest long-term anchors. It represents the average price at which the network's coins last changed hands, and it currently sits near $54,100. Bitcoin remains above it even after this slide, which means the average holder across the whole network is still not carrying any losses.
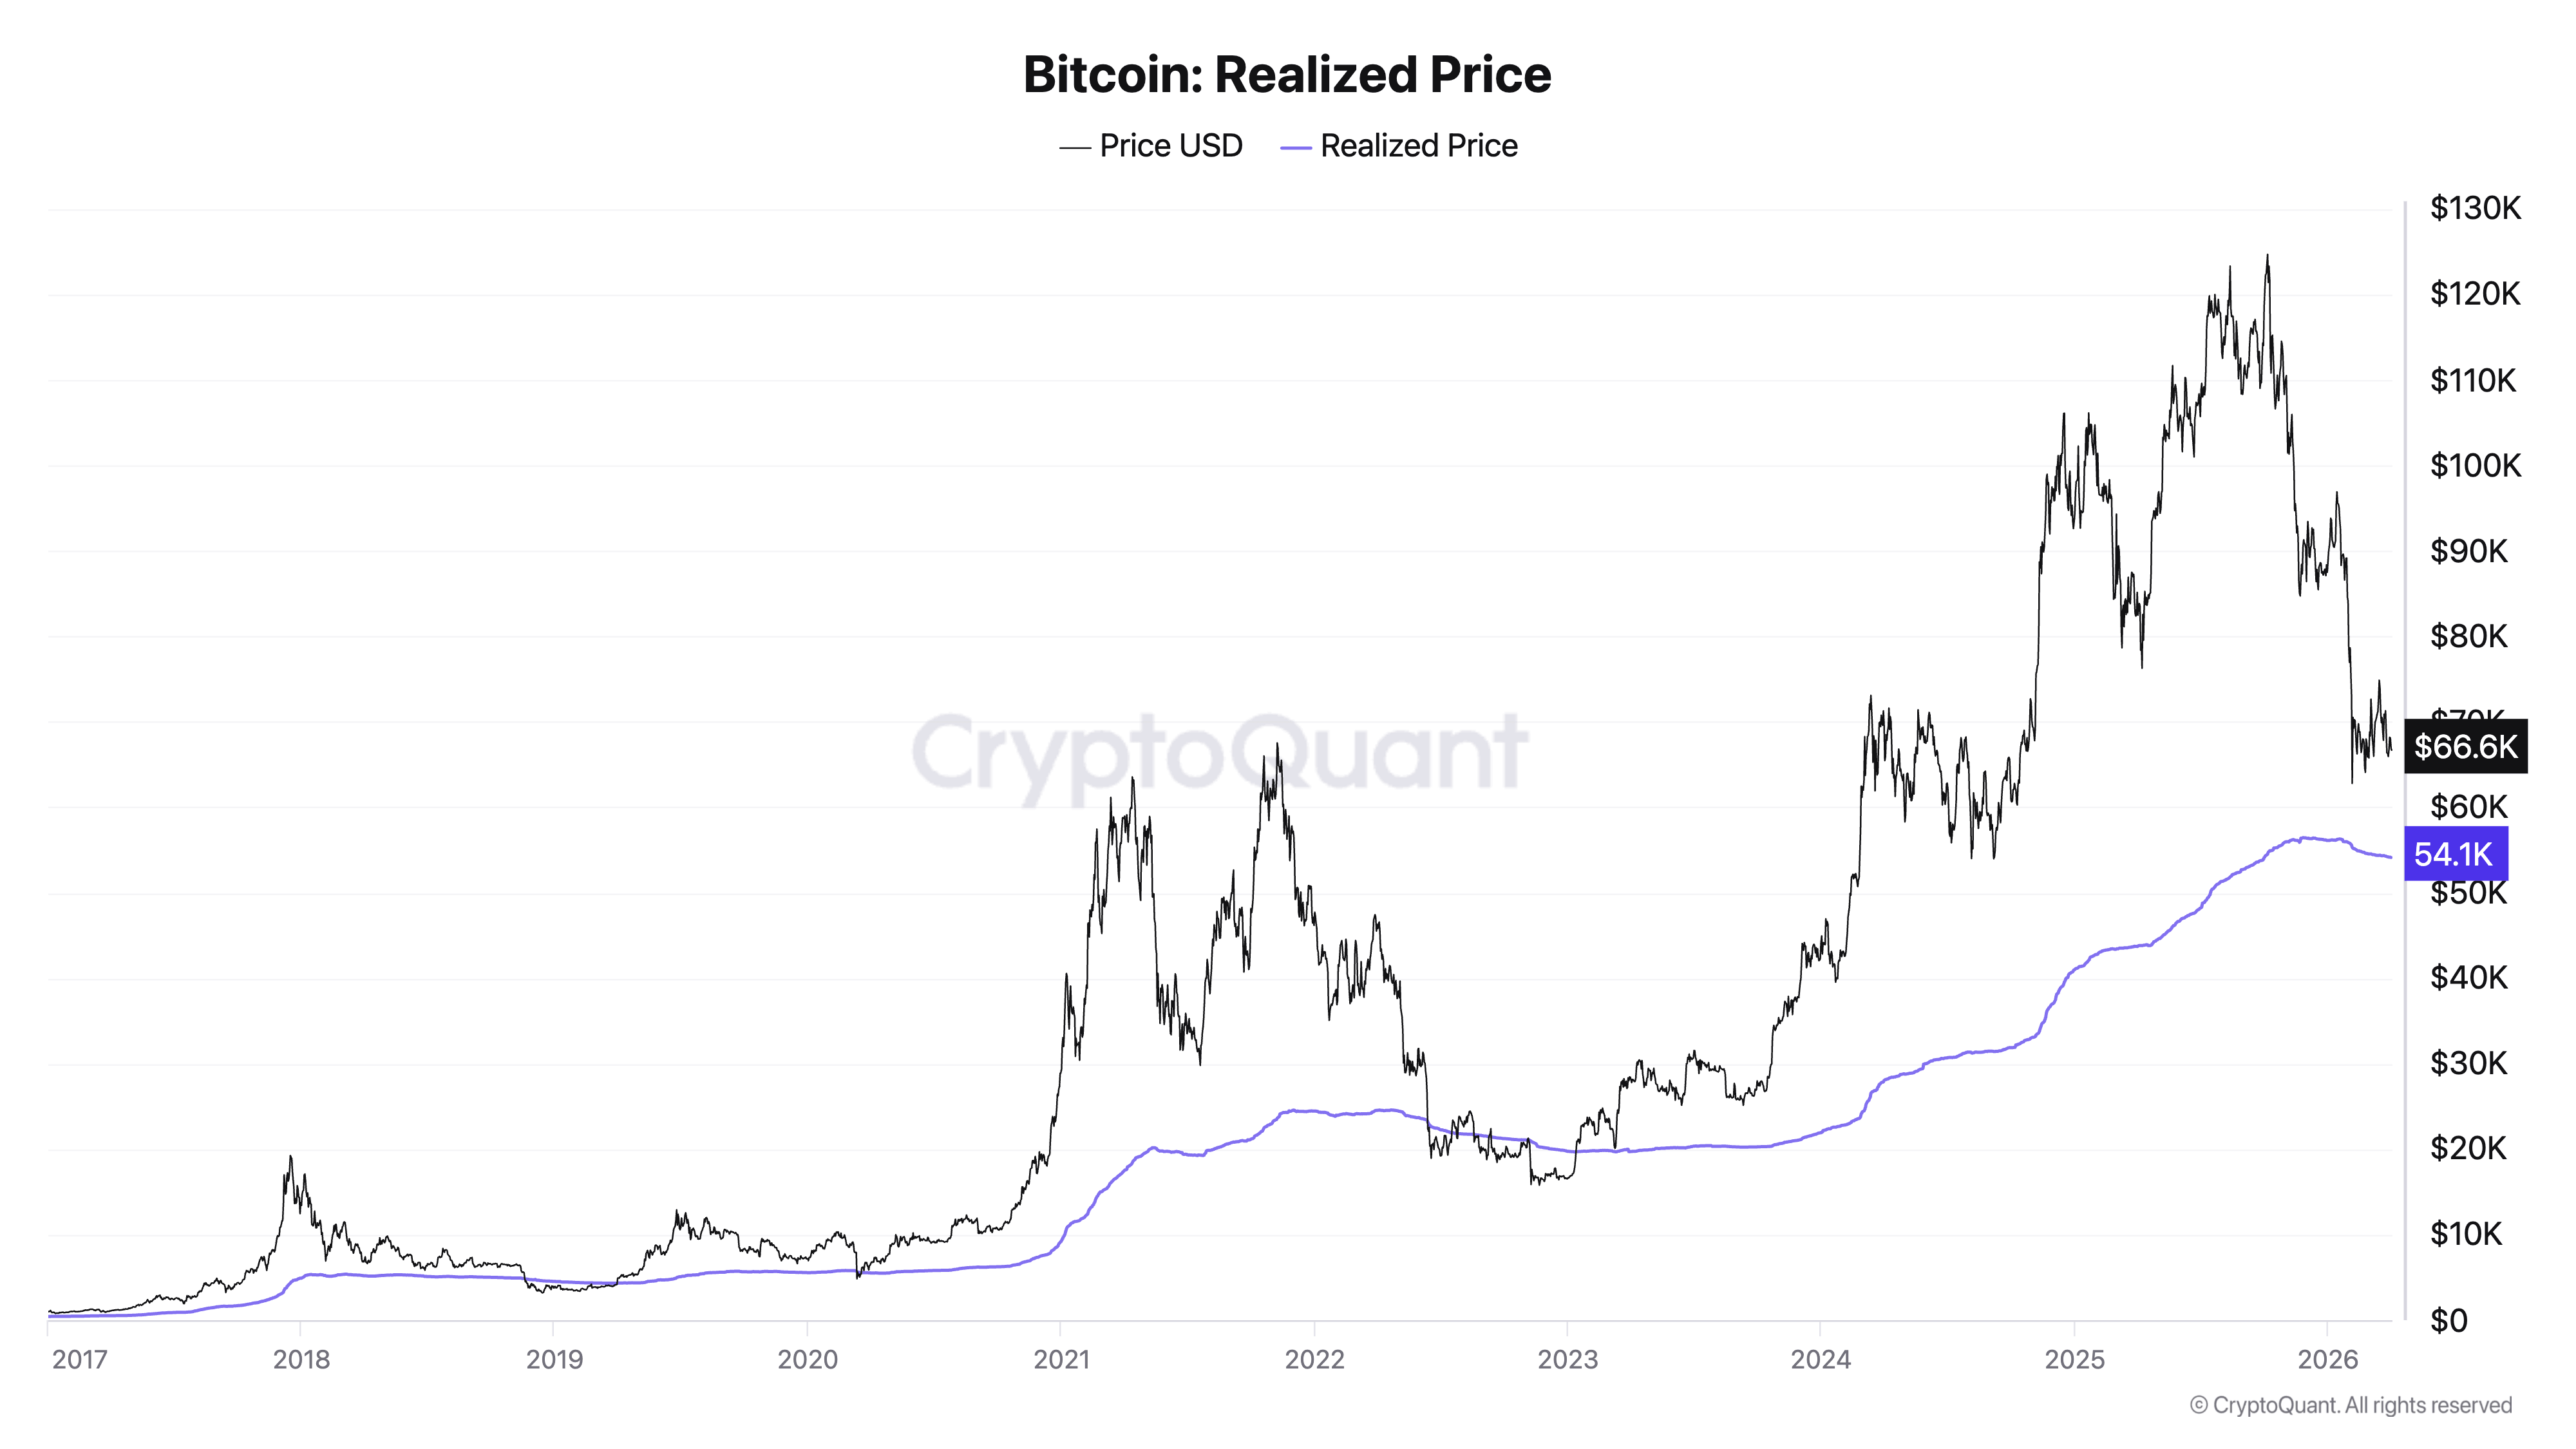
bitcoin's realized price
Graph showing Bitcoin's realized price from Jan. 1, 2017, to Apr. 2, 2026 (Source: CryptoQuant)

The weekly chart confirms this. Bitcoin is also holding above its 200-week moving average, which sits around the high $50,000s, leaving the market in a very unusual position. It feels weak enough to scare people, sour sentiment, and leave a very large share of holders in the red, while the foundational levels that past bear markets reached remain intact.
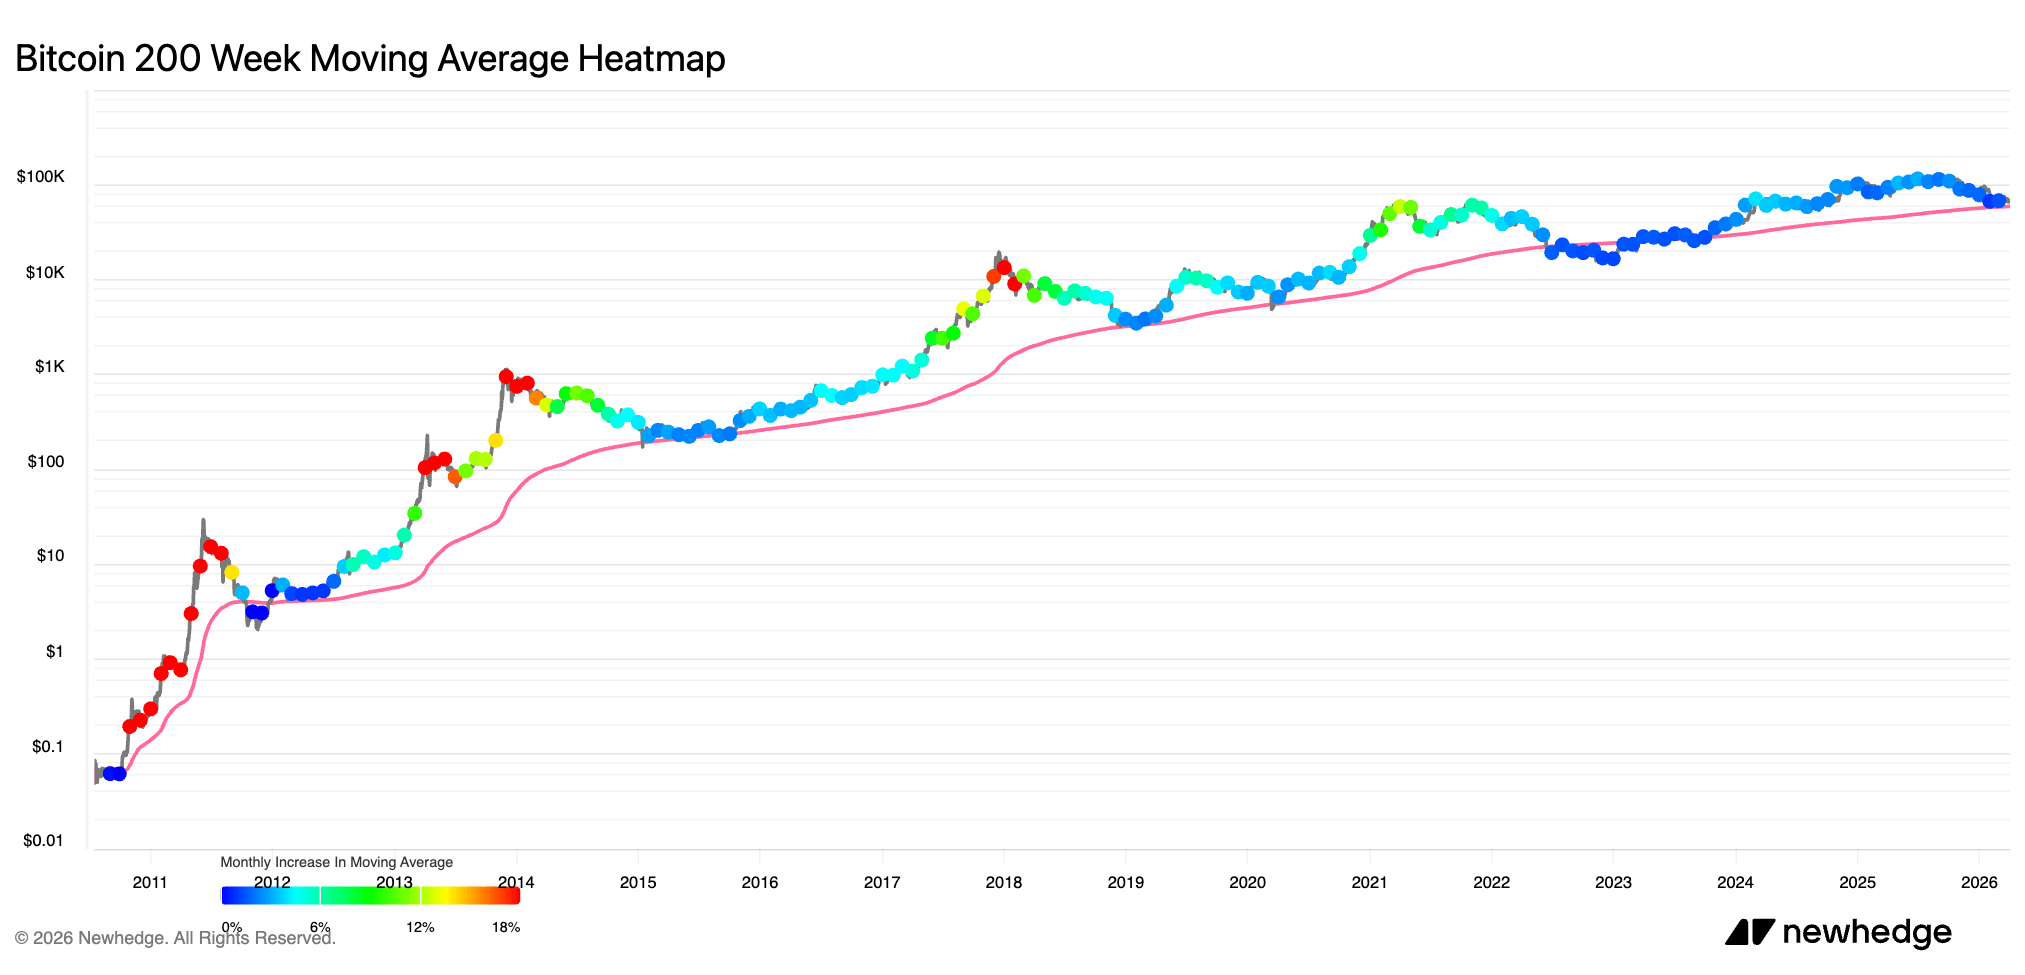
bitcoin 200wma
Graph showing Bitcoin's 200-week moving average from July 2010 to April 2026 (Source: Newhedge)

That distinction may be the clearest difference between this cycle and earlier ones. Bitcoin still behaves like a volatile asset, and drawdowns still inflict real damage, but the altitude at which that damage is occurring has risen considerably. The pain is happening higher up the chart than it used to.

That elevation likely comes from a broader and sturdier owner base. Bitcoin has attracted more long-duration capital and more institutional exposure over the last few years. That gives the market more structural support than it had in previous cycles, when fear could drag prices straight through every historical floor with very little resistance.

The real question, then, is whether this market can absorb more discomfort before it turns into forced selling.

If Bitcoin falls toward $60,000 and holds, this cycle will have demonstrated something meaningful: nearly half the market is already underwater, and the deeper foundation is still standing. If that level gives way and mass selling begins, it won't be long before we see the familiar bear-market sequence play out again.

The visible and structural damages are operating on different levels right now. Bitcoin can still appear relatively fine on a long-term chart while a huge share of holders already feels squeezed, and for anyone watching from outside the asset, that tension is the most useful way to understand the moment.

The market is absorbing a serious amount of pressure, and the question of how much more it can take before the foundation shifts is one that the next few weeks will start to answer.

The post Why $60,000 decides whether Bitcoin’s recent strength cracks as nearly half the market slips into loss appeared first on CryptoSlate.


Share9Tweet6ShareSharePin2

Related Posts

Record user activity and a collapse in whale selling should send XRP soaring, so why is it still pinned at $1?
Analysis

Record user activity and a collapse in whale selling should send XRP soaring, so why is it still pinned at $1?

16.08.2026
0

XRP is back near $1 even as network activity rebounds, whale deposits to Binance collapse, and derivatives exposure builds near...

Read moreDetails
How a public crypto firm’s 4.3% AI gain hides millions in balance sheet losses

How a public crypto firm’s 4.3% AI gain hides millions in balance sheet losses

15.08.2026
Institutional investor Paul Tudor Jones adds 109,446 BlackRock Bitcoin ETF shares while cutting calls by 85%

Institutional investor Paul Tudor Jones adds 109,446 BlackRock Bitcoin ETF shares while cutting calls by 85%

15.08.2026
Why a weekend break below $62,500 could unleash a Bitcoin selling wave toward $58,500

Why a weekend break below $62,500 could unleash a Bitcoin selling wave toward $58,500

15.08.2026
Prediction markets are becoming financial data, but a 63% price does not always mean 63% odds

Prediction markets are becoming financial data, but a 63% price does not always mean 63% odds

15.08.2026
Load More
Next Post
Charles Schwab’s Bitcoin and Ethereum rollout shows crypto is moving deeper into mainstream brokerage accounts

Charles Schwab’s Bitcoin and Ethereum rollout shows crypto is moving deeper into mainstream brokerage accounts

0 0 votes
Рейтинг статьи
Subscribe
Notify of
guest
guest
0 комментариев
Oldest
Newest Most Voted
Inline Feedbacks
View all comments

Recommended

Bitcoin faces ‘endless spot selling’ as BTC price dips below $28.7K

Bitcoin faces ‘endless spot selling’ as BTC price dips below $28.7K

3 years ago
Why a resilient jobs market keeps turning into a Bitcoin sell signal

Why a resilient jobs market keeps turning into a Bitcoin sell signal

2 months ago
Gary Gensler’s Messy Crypto Legacy — And What Happens Next

Gary Gensler’s Messy Crypto Legacy — And What Happens Next

2 years ago
Tron Records $90.04M Revenue in Q1 2023 Despite SEC Crackdown

Tron Records $90.04M Revenue in Q1 2023 Despite SEC Crackdown

3 years ago

Categories

  • All news
  • Altcoins
  • Analysis
  • Bitcoin
  • Blockchain
  • Ethereum
  • NFT
No Result
View All Result

Highlights

Why a weekend break below $62,500 could unleash a Bitcoin selling wave toward $58,500

Prediction markets are becoming financial data, but a 63% price does not always mean 63% odds

Google Gemini AI Predicts Bitcoin Price by the End of 2026

Polymarket CLARITY Act Odds Crashed From 82% to Under 20%, Does September 15 Save the Bill?

“World’s First” Trump Prediction Market Product Killed, What Happened to Truth Predict?

Bitcoin Price Analysis: Can BTC Hit $64K This Weekend?

Trending

Record user activity and a collapse in whale selling should send XRP soaring, so why is it still pinned at $1?
Analysis

Record user activity and a collapse in whale selling should send XRP soaring, so why is it still pinned at $1?

16.08.2026
0

XRP is back near $1 even as network activity rebounds, whale deposits to Binance collapse, and derivatives...

How a public crypto firm’s 4.3% AI gain hides millions in balance sheet losses

How a public crypto firm’s 4.3% AI gain hides millions in balance sheet losses

15.08.2026
Institutional investor Paul Tudor Jones adds 109,446 BlackRock Bitcoin ETF shares while cutting calls by 85%

Institutional investor Paul Tudor Jones adds 109,446 BlackRock Bitcoin ETF shares while cutting calls by 85%

15.08.2026
Why a weekend break below $62,500 could unleash a Bitcoin selling wave toward $58,500

Why a weekend break below $62,500 could unleash a Bitcoin selling wave toward $58,500

15.08.2026
Prediction markets are becoming financial data, but a 63% price does not always mean 63% odds

Prediction markets are becoming financial data, but a 63% price does not always mean 63% odds

15.08.2026
  • All news
  • Altcoins
  • Bitcoin
  • Blockchain
  • Ethereum
  • NFT
  • Analysis
Editor: cryptomediaclub.com@gmail.com
Advertising: digestmediaholding@gmail.com

Disclaimer: Information found on CryptoMediaClub is those of writers quoted. It does not represent the opinions of CryptoMediaClub on whether to sell, buy or hold any investments. You are advised to conduct your own research before making any investment decisions. Use provided information at your own risk.
CryptoMediaClub covers fintech, blockchain and Bitcoin bringing you the latest crypto news and analyses on the future of money.

© 2023 Crypto News. All Rights Reserved

No Result
View All Result
  • All news
  • Bitcoin
  • Ethereum
  • Altcoins
  • NFT
  • Blockchain
  • Analysis

Disclaimer: Information found on CryptoMediaClub is those of writers quoted. It does not represent the opinions of CryptoMediaClub on whether to sell, buy or hold any investments. You are advised to conduct your own research before making any investment decisions. Use provided information at your own risk.
CryptoMediaClub covers fintech, blockchain and Bitcoin bringing you the latest crypto news and analyses on the future of money.

© 2023 Crypto News. All Rights Reserved

wpDiscuz