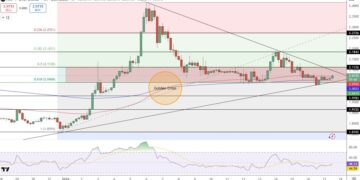
Chainlink (LINK) has recently showcased encouraging signs, especially with its price staying robust above the $7.25 benchmark against the US dollar. Moreover, trading above the critical $7.30 threshold and the notable 100 simple moving average (4 hours) underscores this bullish momentum. A significant bullish trend line has been spotted, offering support near the $7.25 zone on the LINK/USD pair’s 4-hour chart, as data from Kraken illustrates.
LINK Outpaces Bitcoin and Ethereum
Our previous LINK price evaluation highlighted the potential for further elevation beyond the $7.00 mark against the US dollar. Consequently, the currency didn’t just hold its ground but also surged past the $7.25 boundary. Significantly, Chainlink continued. It surpassed the $7.50 mark, reaching a commendable $7.56 high, outclassing giants like Bitcoin and Ethereum in its ascent. However, a slight downward correction took the price below $7.40, nudging it to test the 23.6% Fib retracement level. This was from its rise from the $6.60 low to its $7.56 peak.
Additionally, LINK maintains its position above the $6.50 mark and the vital 100 simple moving average (4 hours). LINK’s potential is evident with the ongoing formation of a bullish trend line that finds support around the $7.25 mark. However, if LINK sees a further surge, it might encounter resistance close to the $7.45 mark. The primary resistance, though, lies near the $7.50 zone. Breaking past this zone could open the gates for a consistent climb aiming for the $8.00 to $8.20 regions. Moreover, moving past the $8.50 resistance might propel LINK to challenge the $8.80 mark.
Assessing Downside Risks
It might face a downside stretch if Chainlink struggles to soar past the $7.50 resistance. Initial support in this scenario hovers around the $7.25 mark. The next substantial support lies close to the $6.95 level or the 61.8% Fib retracement level, traced from its rise from $6.60 to $7.56. Failing this, LINK could aim for the $6.80 mark. Any further decline could then redirect LINK towards the imminent $6.60 region.
Key Technical Data at a Glance
Four hours MACD: The LINK/USD MACD hints at waning bullish momentum.
Four hours RSI: LINK/USD’s RSI is above 50.
Principal Support Zones: $7.25 & $6.95.
Major Resistance Zones: $7.50 & $8.50.
The post Chainlink’s Bullish Trajectory: A Close Analysis of LINK’s Price Momentum appeared first on BitcoinWorld.


